Livin' La Vida Luna y Luca

Maxin' & Relaxin'
Let's look at YTD returns for a few indices + BTC.
- SP500: -22%
- Nasdaq: -31%
- Dow: -15%
- BTC: -60%
It's safe to say most long-position investors have taken an absolute beating this year.
Some pundits say we've hit bottom. Others say there is more room to fall.
I don't have an opinion.
I'm not in the prediction game. I'm in the preparation game.
A Few Graphics
Before telling you our plan, I'll share 3 graphics to provide some background.
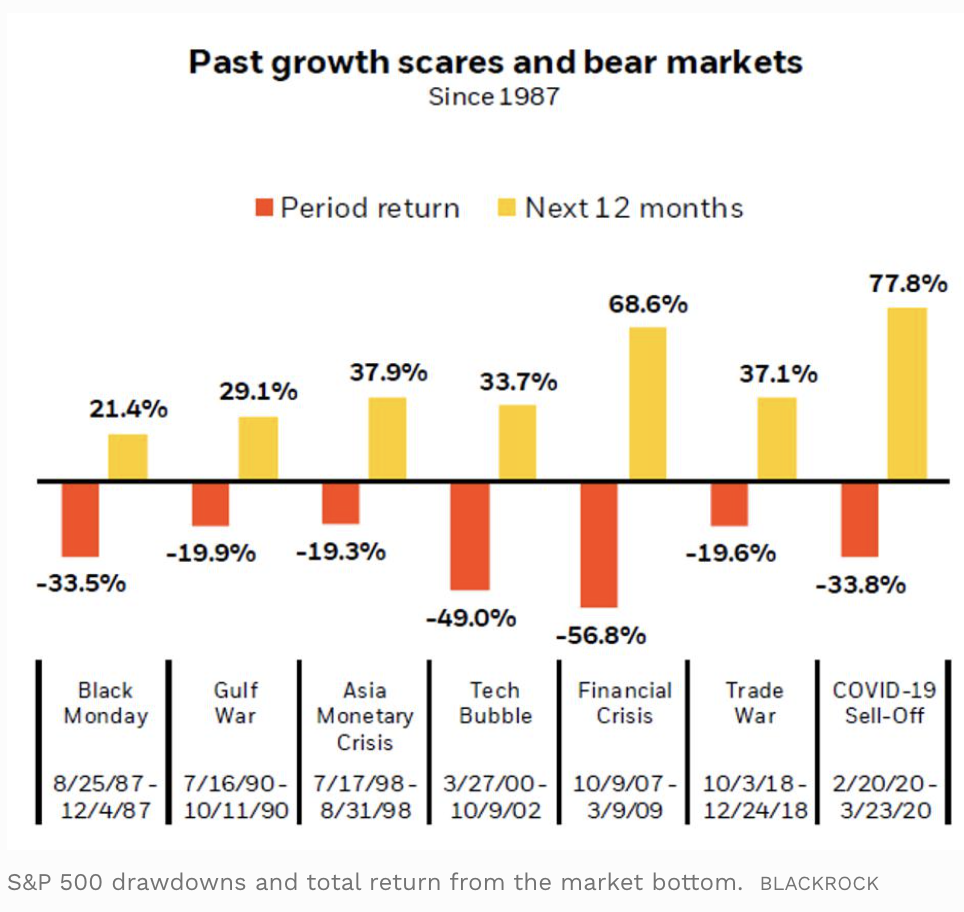
This chart shows how far the SP500 fell during a bear market and how much it recovered in the proceeding 12 months (since 1987).
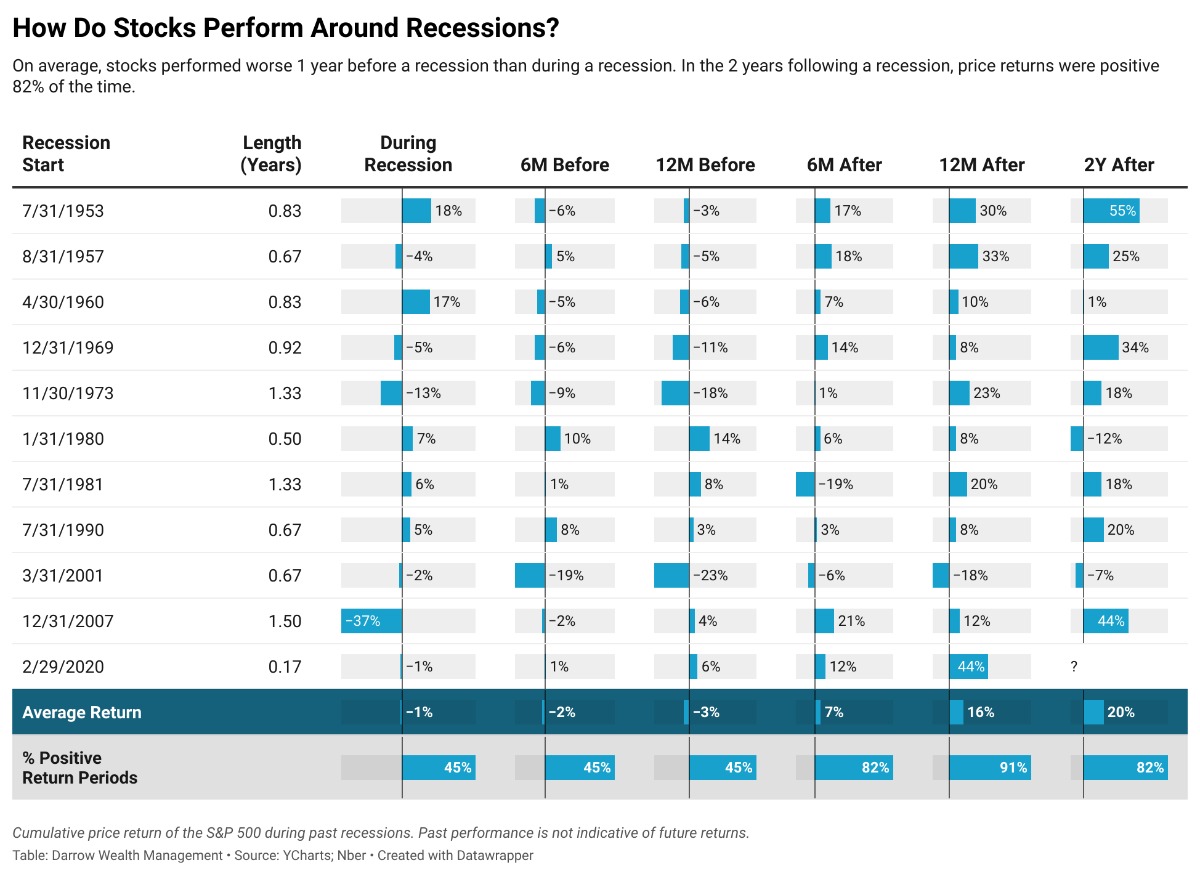
This chart shows us how the SP500 performed 12 months before to 24 months after each recession since 1953.
A recession is typically defined as 2 consecutive quarters of negative GDP Growth.
The major takeaway is 82% of the time we experience a positive return 2 years after a recession.

This chart shows the return profile for $20,000 invested on 12/31/1979 based on how many of the best days the investor missed.
On the surface, this seems like a ridiculous chart. How could anyone "only" / "coincidentally" miss the best X days of the market?
That's not what I take from this chart. I'm looking at the top left corner where it says, "8 of the 10 worst performing days happened WITHIN 1 week of the 10 best performing days.
Why is that so important?
Those soul-crushing, blood-red days get investors to tap out and sell.
Letting your emotions get the best of you costs you double! If you cash out after a drop, you'll probably miss the rebound that would otherwise make you whole.
Our Plan
...hasn't changed.
We continue to DCA (dollar cost average) into the market every single month.
It's proven difficult, especially this year.
With Dia's new job, and the steady growth in my business, our income increased substantially this year.
However, despite earning more & contributing the same amount to our retirement accounts, our net worth has stayed relatively flat because our portfolios have compressed in value.
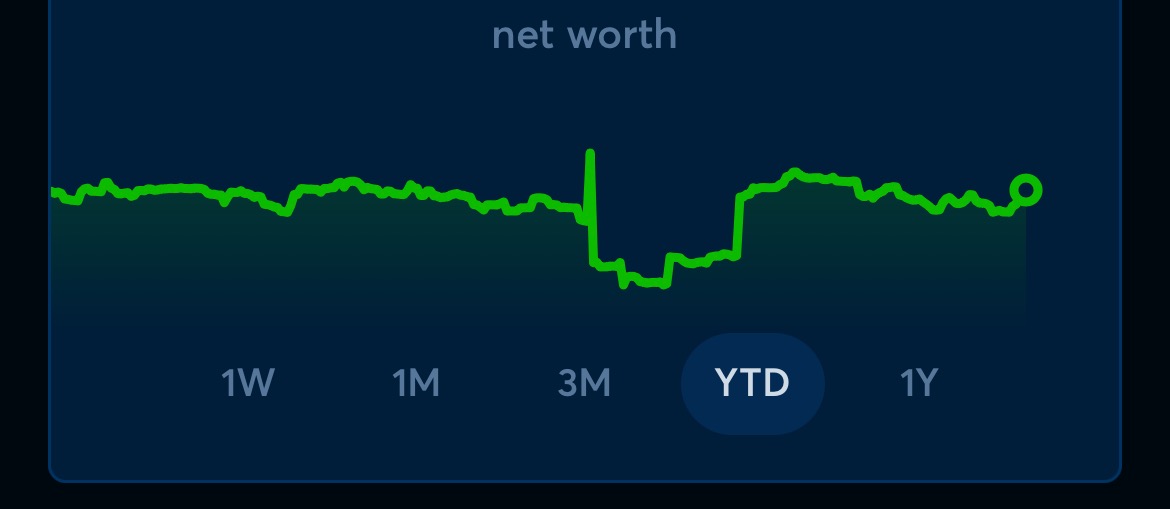
So let's say at the beginning of the year our portfolio was worth $100.
Since then, that initial investment dropped in value to $80 (-20%). But all the while, we've been periodically investing more in the market. Enough to bring us back to our original $100 total value.
On the surface, it may seem like we're chasing good money after bad. But that's not the case.
Why?
Let's say we started the year with 100 shares at $1 each.
Since then, those 100 shares have shrunk in value to .80 cents each.
We've also bought $20 of shares (at a lower valuation). Let's split the difference and say we bought $20 worth of shares at .90 cents throughout this year.
20 dollars / .90 c/share = 22 new shares.
So although our portfolio value is still $100, we own 122 shares instead of the 100 we started with.
When those shares eventually get back to $1 (& beyond), we'll have $122 instead of $100.
Embrace the Rollercoaster
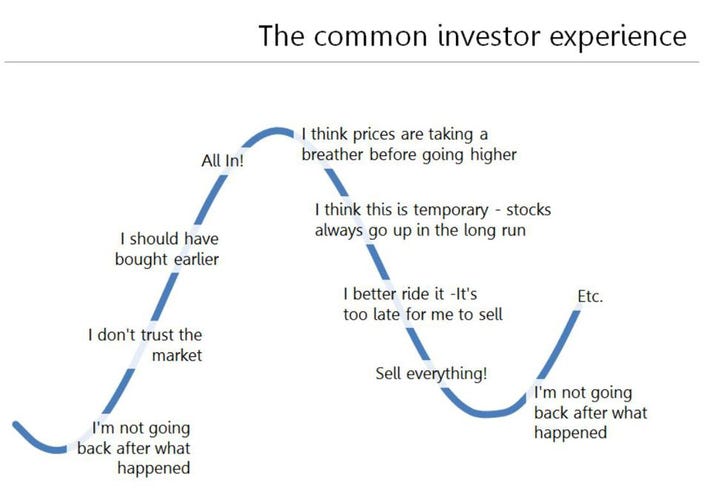
Selling out of fear tends to keep investors out of the market for far too long.
They end up giving up a lot of ground in the early days of the subsequent recovery.
HODL For The Long Term
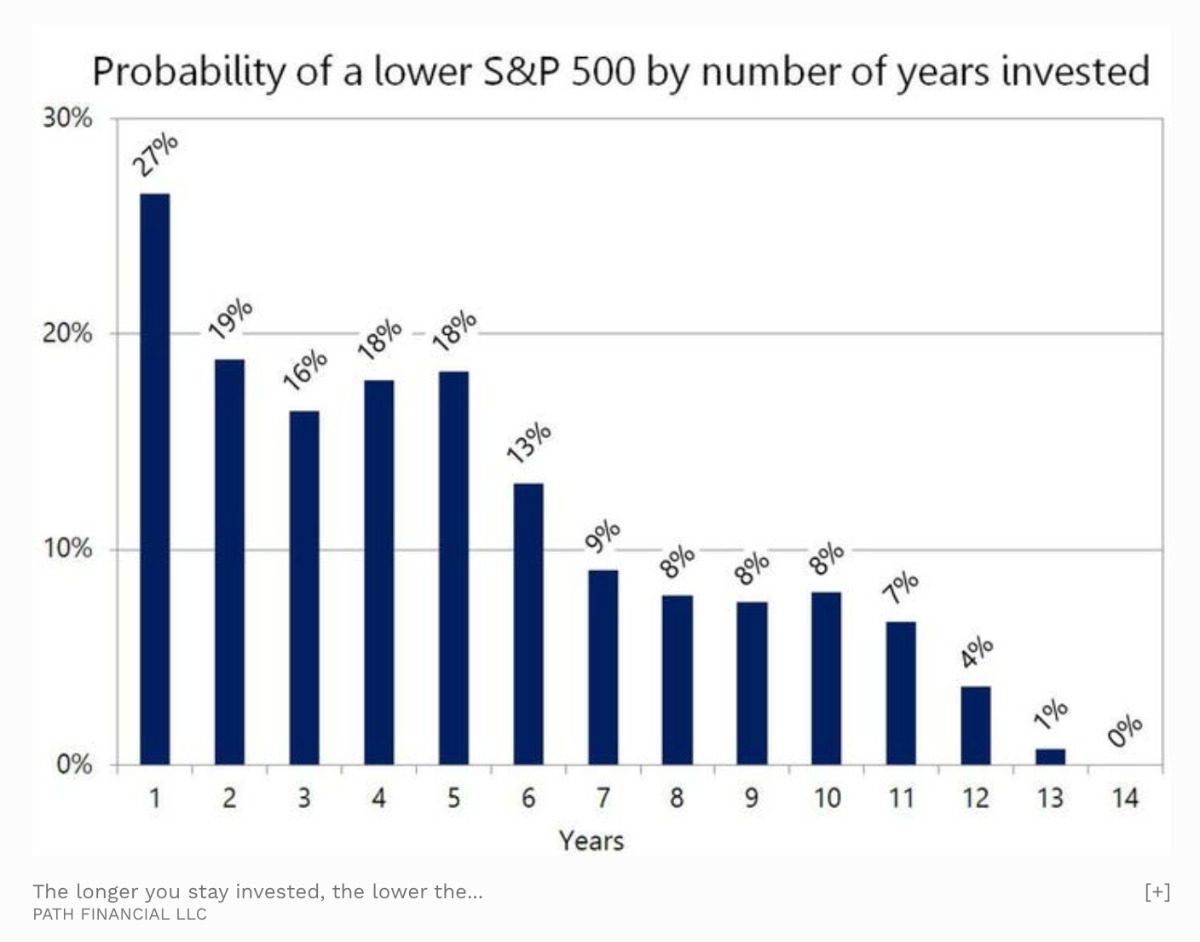
The longer you hold, the less likely you'll have a negative return.
If you can stay invested for at least 14 years, the probability of losing money is virtually 0. 🤯
The Psychology of Money
... is a pretty popular book written by Morgan Housel.

I've been meaning to revisit that book given the current economic situation.
Next week's email will go into my notes on that book.
See you then 😉